eGaN Technology Reliability and Physics of Failure
GaN Talk – Alex Lidow, Ph.D.
Jul 12, 2016
Introduction to GaN Reliability
Efficient Power Conversion (EPC) Corporation’s enhancement-mode gallium nitride (eGaN®) FETs continue to expand into new market applications due to the competitive performance advantages over traditional power MOSFETs. Wireless power, DC-DC conversion, RF base station transmission, satellite systems, audio amplifiers, and LiDAR are just a few example applications that can take advantage of the superior performance of eGaN FETs.
Thirty years of silicon power-MOSFET development taught us that one of the key variables controlling the adoption rate of a disruptive technology is whether or not the product is reliable enough to use in the application. This principle has guided the design of EPC’s enhancement mode gallium nitride devices.
In this series we will look at the various ways the reliability of eGaN technology has been validated, and how we are developing models from our understanding of the physics of failures that can help predict failure rates under almost any operating condition. Detailed reports of the reliability studies and testing results discussed in this series can be found here.
In this first installment and the next, we will look at the field experience from the past six years of GaN transistors use in a variety of applications from vehicle headlamps to medical systems to 4G/LTE telecom systems. Diving into the failure of each and every part leads to some valuable lessons learned.
In the third installment, we will review the basic qualification testing results from over seven million actual hours of maximum stress on over 10,000 parts. Results from traditional electrical stress, environmental stress, and thermo-mechanical stress testing demonstrates that GaN technology can certainly pass any of the tests required of MOSFETs. We also will review early life failure rates based on several thousands of parts tested. However, unless we understand the underlying physics of failure we do not know how to extrapolate these maximum-stress results to real-world stress conditions.
The fourth and fifth installments will discuss the basic physics behind wear-out mechanisms associated with electrical stress, thermo-electrical stress, and thermo-mechanical stress. Finally, the sixth article will be more than just a summary, it will bring in all the new information that has been developed over the months separating the first and last of these discussions.
Field Reliability of eGaN FETs
Of utmost importance throughout the testing and the discussions given in these reports is how reliable eGaN FETs are while operating in customer applications. EPC monitors field reliability data to gauge reliability in customer applications. Over the past six years, we have tracked field returns and the total number of units deployed in the field. Figure 1 shows the distribution of accumulated field device hours amongst EPC different product families. At the time of this writing (February 2016), over 17 billion total device hours have been tracked in the field. Of the 127 total field returns during that time span, only three have been related to eGaN FETs failing within operating limits. The remaining failures were determined to be related to the assembly of the eGaN FETs or poor PCB layout.
Figure 2 shows the trend of FIT rate (Failures in 109 hours) for field reliability of all shipped eGaN products over the past six years. For these calculations, we assume that all products are deployed and remain in service from their original ship date. The values in this figure represent the upper bound on the FIT rate (at a 60% confidence level), based on the total accumulated device hours in the field and the confirmed field failures. Overall our field experience is approximately 0.24 FITs, which is at least comparable to silicon MOSFETs. Also, there is no evidence in the trend chart of an increased FIT rate in later years, which would suggest “wear out” is not an issue over the six year span.
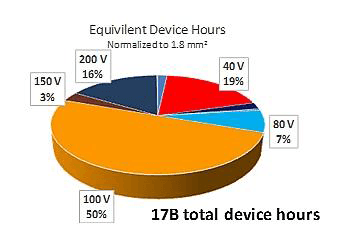
Figure 1: Pie chart showing the distribution of accumulated field device hours amongst EPC different product families.

Figure 2: Field reliability trend chart for all deployed eGaN products over the past six years. Values represent 60% confidence upper bound on the FIT rate.
In our next installment, we will look in greater detail into the three main causes of field failure; assembly, layout or circuit design, and failures caused by flaws inside the device. By examining the root causes of each, we can separate those issues that are related to ascending the learning curve associated with a state-of-the-art technology from those related to the technology itself.